Laboratory Work
Experiment 1: Caspofungin Growth Curve
The caspofungin plate spotting assay we set up last week did not show any differences between wild-type and apm4Δ mutant strains in their ability to grow in the presence of various concentrations of caspofungin.
Because of this, we decided to do a literature search to find other caspofungin sensitivity assays in order to double check our results. With help from Harriet, I adapted an experiment which measured the OD600 of cells growing in YPD media supplemented with various concentrations of caspofungin. As it would not be accurate to measure the OD of hyphal cells as an indication of total population size, we could only do this experiment with yeast. In addition, due to the fact that I needed to include three repeats for each caspofungin concentration, I limited the number of concentrations used in the experiment to two. I decided to measure the OD of our samples at t = 0, 2, 6 and 24 hours; and staggered the times at which I introduced cultures into media in order to allow myself time to collect the OD readings at a given time point. Surprisingly, everything went smoothly; although I credit this to Harriet helping me set everything up at the beginning! I found that there appeared to be a discrepancy between the growth of the wild-type and mutant strains in 0.5 µg/mL caspofungin, although this was not statistically significant. Hopefully next week I can repeat this experiment; this time using 0.5 µg/mL and 0.2 µg/mL caspofungin.
Experiment 2: Microscopy using Calcofluor White
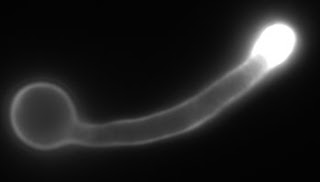
Due to our cells being infected last week, I simply grew up some fresh cells in liquid culture and stained them again with calcofluor white, which binds to chitin in the cell wall. There appeared to be a difference in chitin distribution between wild-type and apm4Δ mutant hyphal cells; namely that chitin was distributed more towards the hyphal tip in wild-type cells.
As it is good practice to repeat an experiment 3 times to show results are reproducible, I will be repeating this experiment next week.
Experiment 1: Caspofungin Growth Curve
The caspofungin plate spotting assay we set up last week did not show any differences between wild-type and apm4Δ mutant strains in their ability to grow in the presence of various concentrations of caspofungin.
Because of this, we decided to do a literature search to find other caspofungin sensitivity assays in order to double check our results. With help from Harriet, I adapted an experiment which measured the OD600 of cells growing in YPD media supplemented with various concentrations of caspofungin. As it would not be accurate to measure the OD of hyphal cells as an indication of total population size, we could only do this experiment with yeast. In addition, due to the fact that I needed to include three repeats for each caspofungin concentration, I limited the number of concentrations used in the experiment to two. I decided to measure the OD of our samples at t = 0, 2, 6 and 24 hours; and staggered the times at which I introduced cultures into media in order to allow myself time to collect the OD readings at a given time point. Surprisingly, everything went smoothly; although I credit this to Harriet helping me set everything up at the beginning! I found that there appeared to be a discrepancy between the growth of the wild-type and mutant strains in 0.5 µg/mL caspofungin, although this was not statistically significant. Hopefully next week I can repeat this experiment; this time using 0.5 µg/mL and 0.2 µg/mL caspofungin.
Experiment 2: Microscopy using Calcofluor White
Due to our cells being infected last week, I simply grew up some fresh cells in liquid culture and stained them again with calcofluor white, which binds to chitin in the cell wall. There appeared to be a difference in chitin distribution between wild-type and apm4Δ mutant hyphal cells; namely that chitin was distributed more towards the hyphal tip in wild-type cells.
 |
| Wild-type Hyphae Stained with Calcofluor White. |
 |
| apm4Δ Hyphae Stained with Calcofluor White. |


Comments
Post a Comment